Temperature Monitor
This example shows how to implement a simple real time temperature monitor in JavaScript for a mobile device. This implementation require an Xively account (www.xively.com) in order to get the historical data sequence in a chart format.

smartphone interface example
Note: Indeed this example can be used to display any analog value that you can sensing from any on the Arduino's Analog inputs (A0 to A3). We use a LM35 temperature sensor merely as application example.
Xively Configuration (Cosm)
This screen allows you send to Cosm (www.xively.com) the values received from or transmitted to the remote device over each channel.

- Stream ID: This field allows you to set the Xvely's (Cosm) datastream where you want to send the signal.
- IN / OUT: This option allows you to indicate if you want to send a readed value (input) from the remote device or the written value (output) to the remote device for each channel.
- Constant and Offset: The main advantage of this feature is that it allows you to apply a basic transfer function to your signal before sending it to Xively (Cosm):
f(x) = x * K + offset
- ON: This option allows you to turn on or off the data feed to Xively (Cosm).
- Xively Feed and API Key: This option allows you to configure the required parameters to connect succesfully to www.xively.com.
Configuring the Manual Mode
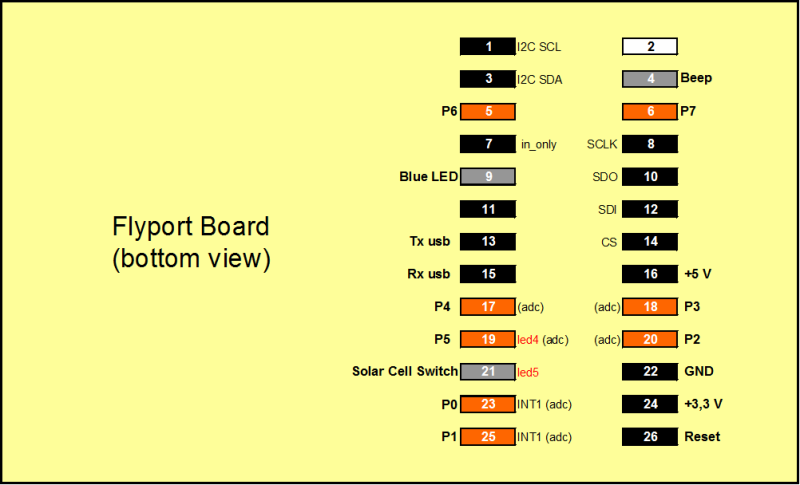
In order to get samples from the sensor in a continous way, you should configure the ADC_INPUT service in manual mode for the selected channel (the port in which the sensor will be connected). In this example we will use the Channel 0 (pin 3 in an Arduino platform). The following picture shows this configuration.

Javascript Code
The following code will allow you to display the sensed temperature in a graphical way from a mobile device or desktop computer. In order to run this example, download the following file in you mobile device or computer and execute it. Double click onto the downloaded "html" file in order to run it on your default browser.
This example is intended to use an LM35 linear temperature sensor but you can use any sensor that you want (you only should change
conversion factor). In this example a conversion factor of  (5000 / 1023) / 10 ) is used because the (10bits) ADC Internal reference
is fixed at 5000mV and the LM35 internal constant is 10mV/ºC.

Note that the Xively transfer function does not affect the value read with the ADC_INPUT service.
Download: TemperatureChart_v01.zip [1]

In order to run this example you should edit it (eg. notepad) and replace the following parameters:
var device_id  = "NB100xxx";		// You NearBus Device ID
var user       = "****";            	// Your NearBus Web user
var pass       = "****";            	// Your NearBus Web password
<!DOCTYPE html>
<!-- ****************************************************************************************************************************** -->
<!-- * NEARBUS JAVASCRIPT EXAMPLE - www.nearbus.net                                                                               * -->
<!-- * Description: This simple code shows how to implement a temperature chart indicator on a Smartphone                         * -->
<!-- * This example requires an Xively account (www.xively.com) in order to record the temperature in a historical way            * -->
<!-- * The system is configured to work with a LM35 (lineal Temp Sensor (ºC)                                                      * -->
<!-- * Support: info@nearbus.net                                                                                                  * -->
<!-- ****************************************************************************************************************************** -->
<!-- * REVISION HISTORY                                                                                                           * -->
<!-- * v0.1 - 05-11-13 - Initial Release                                                                                          * -->
<!-- ****************************************************************************************************************************** -->

<html>
<head>
<script src="http://code.jquery.com/jquery-1.9.1.min.js"></script>
<script type="text/javascript" src="PAGE" ></script>
<script type='text/javascript' src='http://nearbus.net/downloads/js_apps/nearapi_v05.js'></script>


<script>
// +--------------------------------------------------------------------+
// | To run this example you should replace the following parameters    |
// | device_id         Your device ID, or.. devices ID :)               |
// | user              Your NearBus Web user                            |
// | pass              Your NearBus Web password                        |
// +--------------------------------------------------------------------+


//////////////////////////////////
// MAIN CONFIGURATION
//////////////////////////////////
var device_id     = "NB100xxx";     // Your device ID
var    user       = "****";         // Your NearBus Web user
var pass          = "****";         // Your NearBus Web password
var LOOP_DELAY    = 2000;


    window.onload = function ()
    {
        ///////////////////////////////////
        // Function: Main Loop
        ///////////////////////////////////
        setInterval( function()
        {
            ret = NearAPIjs( "ADC_INPUT", device_id , 0, 0, "RONLY" );
            if( ret != "WAIT" ) {
                var temperature = ( ret * (5000/1023) / 10 );
                $('#field_1').text( temperature.toString() );
            }
        }, LOOP_DELAY );
    }


</script>

<body bgcolor="#000">
<br />
<p><div style="text-align:center; width:950px"><img src="http://nearbus.net/images/logo_nearbus.png" width="140" heisgth="78"</div></p>
<br />
<p><div style="text-align:center; width:950px; font: bold 60px Arial; color:orange;">TEMPERATURE CHART</div></p>
<br />

<!-- this line embed a 750 x 400px feed chart form www.xively.com (former cosm.com) -->
<!-- you should replace the "feed" and the "zone" in order to get the chart from www.xively.com  -->
<div id="div_temp_chart_cm"> <img src="https://api.cosm.com/v2/feeds/***your_feed_here***/datastreams/0.png?width=750&height=400&colour=%23f15a24&duration=3hours&show_axis_labels=true&detailed_grid=true&timezone=***your_zone_here***" > </div>

<br />
<br />
<p><div style="text-align:center; width:950px; font: bold 60px Arial; color:orange;">celsius</div></p>
<p><div id="field_1" style="text-align:center; width:950px; font: bold 300px Arial; color:orange;">. . . .</div></p>
</body>
</html>